ForestFire Model#
The ForestFire model simulates the development of a forest under influence of fires and was first proposed by P. Bak, K. Chen, and C. Tang in 1990.
Trees grow on a random basis and lightning causes them and the trees in the same cluster to burn down instantaneously; this is the so-called “two state model”.
Implementation#
The forest is modelled as a cellular automaton where each cell has can be in one of two states: empty or tree.
The update procedure is as follows: in each iteration step, iterate over all cells in a random order. For each cell, one of two actions can take place, depending on the current state of the cell:
An
emptycell becomes atreewith probabilityp_growth.A
treeignites with a probabilityp_lightningand ignites all cells indirectly connected to it. The cluster burns down instantaneously and all cells transition to stateempty.
The new state of a cell is applied directly after it was iterated over, i.e. cell states are updated sequentially.
Heterogeneities#
There is the possibility to introduce heterogeneities into the grid, which are implemented as two additional possible cell states: source and stone:
A cell can be a constantly ignited fire
source, instantly burning down a cluster that comes into contact with it.A cell can be a
stone, being immune to fire and not taking part in any model dynamics.
These heterogeneities are controlled via the ignite_permanantly and stones entries of the model configuration, which both make use of the entity selection interface.
Data Output#
The following data is stored alongside the simulation:
kind: the state of each cell. Possible values:0:empty1:tree2: (not used)3:source, is constantly ignited4:stone, does not take part in any interaction
age: the age of each tree, reset after lightning strikescluster_id: a number identifying to which cluster a cell belongs;0for non-tree cellstree_density: the global tree density
Simulation Results#
Below, some example simulation results are shown. If not marked otherwise, the default values (see below) were used and the grid was chosen to have 1024x1024 cells.
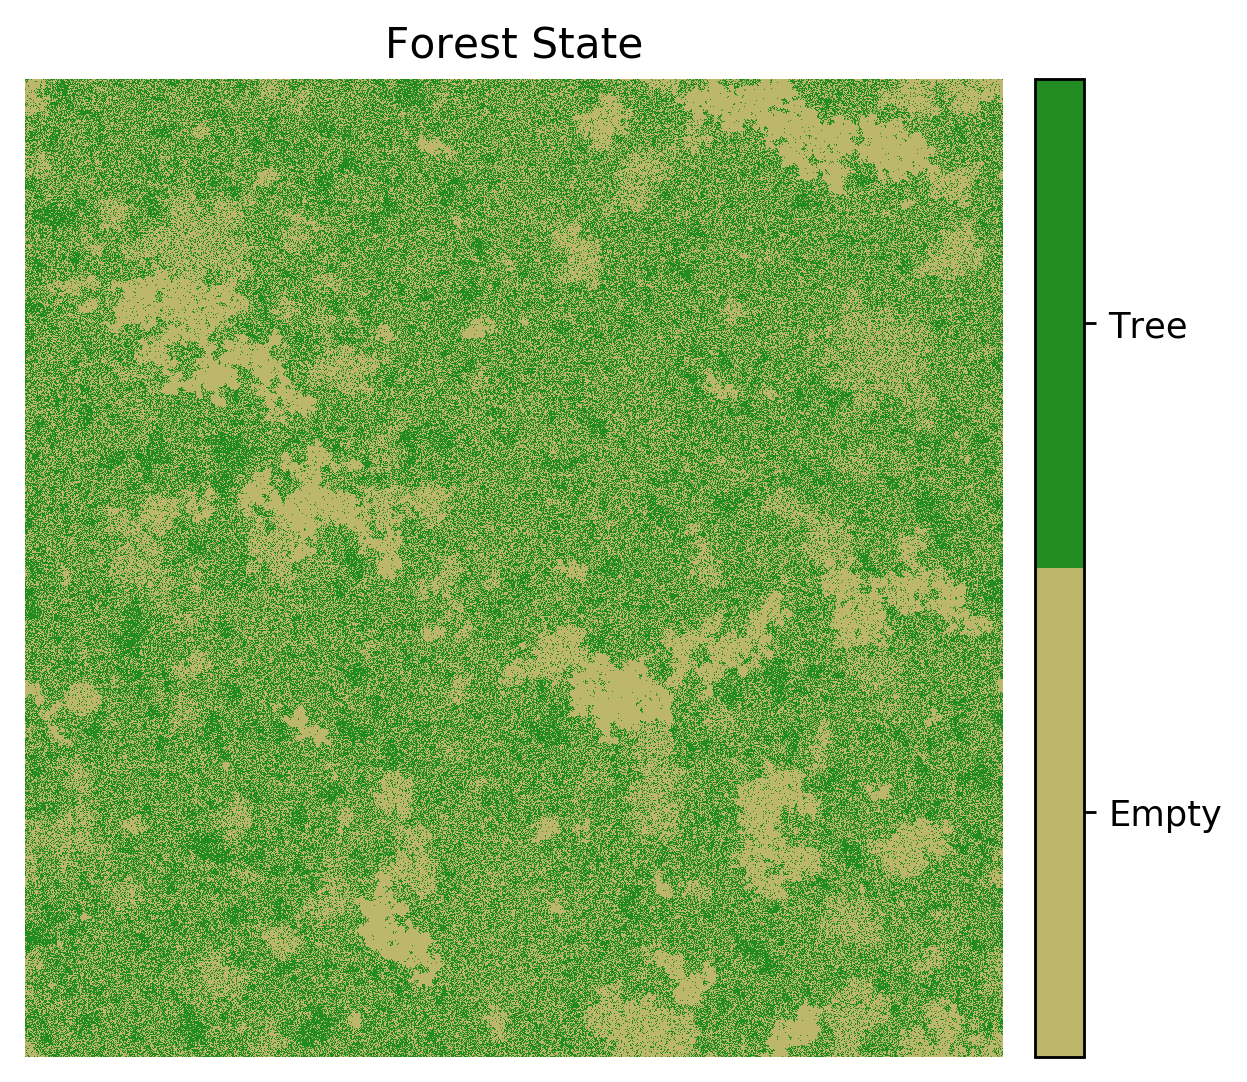
Spatial Representation#
Snapshots of the forest state, its age, and the identified clusters after 223 iteration steps:


Tree Density#
The time development of the tree density shows how the system relaxes into its quasi-stable equilibrium state.

Cluster Size Analysis#
In a complementary cumulative cluster size distribution plot, the scale-free nature of the system can be deduced by observing those parts of the plot that appear linear in a log-log representation.

Default Configuration Parameters#
Below are the default configuration parameters for the ForestFire model:
# --- Space -------------------------------------------------------------------
space:
  periodic: !is-bool true


# --- CellManager and cell initialization -------------------------------------
cell_manager:
  grid:
    structure: square
    resolution: !is-positive 64

  neighborhood:
    mode: !param
      default: Moore
      is_any_of: [empty, vonNeumann, Moore, hexagonal]

  # Initialization parameters for each cell
  cell_params:
    # With this probability, a cell is initialized as tree (instead of empty)
    p_tree: !is-probability 0.2
    # NOTE Macroscopically, this is equivalent to the initial tree density


# --- Model Dynamics ----------------------------------------------------------
# Probability per site and time step to transition from state empty to tree
p_growth: !is-probability 7.5e-3

# Probability per site and time step to transition to burning state, burning
# down the whole cluster
p_lightning: !is-probability 1e-05

# Probability (per neighbor) to _not_ catch fire from a burning neighbor
p_immunity: !is-probability 0.


# --- Heterogeneities ---------------------------------------------------------
# Some cells can be permanently ignited or turned into stones.
# Both these features are using the `select_entities` interface; consult the
# documentation regarding information on available selection modes.

# Turn some cells into stones: these do not take part in any of the processes
stones:
  enabled: !is-bool false
  mode: !param
    name: selection mode for stones
    default: clustered_simple
    is_any_of: &selection_modes
      - sample
      - probability
      - position
      - boundary
      - lanes
      - clustered_simple

  # Clustering parameters
  p_seed: !is-probability .02     # Probability for a cell being a cluster seed
  p_attach: !is-probability .1    # Attachment probability (per neighbor)
  num_passes: !is-unsigned 5      # How many attachment procedures to perform

  # Depending on mode, can pass additional parameters here.

# Set some cells on fire permanently (invoked after stones are set)
ignite_permanently:
  enabled: !is-bool false
  mode: !param
    name: selection mode for permanently ignited cells
    default: boundary
    is_any_of: *selection_modes

  # Boundary selection parameters (requires space to be set to NON-periodic!)
  boundary: !param
    default: bottom
    is_any_of: [bottom, top, left, right, all]


# --- Output Configuration ----------------------------------------------------
# Whether to only write out the tree density; useful for runs on large grids
# where spatial information is not needed.
write_only_tree_density: !is-bool false
Available Plots#
The following plot configurations are available for the ForestFire model:
Default Plot Configuration#
# --- Cluster size distribution plots -----------------------------------------
cluster_size_distribution:
  based_on: cluster_size_distribution

# Animation over time
cluster_size_distribution_animated:
  enabled: false
  based_on: cluster_size_distribution_animated

# The complementary cumulative cluster size distribution
# ... for each universe
compl_cum_cluster_size_dist:
  enabled: false
  based_on: compl_cum_cluster_size_dist.universe

# ... for a multiverse sweep, using auto-encoding
compl_cum_cluster_size_dist_facet_grid:
  based_on: compl_cum_cluster_size_dist.multiverse


# --- Tree density ------------------------------------------------------------
# ... of the single universes
tree_density:
  based_on: tree_density


# ... facet grid with auto-encoding for multiverse sweep plots
tree_density_facet_grid:
  based_on: tree_density_facet_grid


# ... asymptotic tree density with specializations
tree_density_asymptotic:
  based_on: tree_density_asymptotic
  enabled: false

tree_density_asymptotic_over_p_lightning:
  based_on: tree_density_asymptotic_over_p_lightning
  enabled: false


# --- Tree age ----------------------------------------------------------------
mean_tree_age:
  based_on: mean_tree_age


# --- CA plots ----------------------------------------------------------------
# ... The forest ..............................................................
ca/forest:
  based_on: ca/forest

ca/forest_final:
  based_on:
    - ca/forest
    - .plot.ca.snapshot

# ... The forest age ..........................................................
ca/forest_age:
  based_on: ca/forest_age

ca/forest_age_final:
  enabled: false
  based_on:
    - ca/forest_age
    - .plot.ca.snapshot

# ... The clusters ............................................................
ca/clusters:
  based_on: ca/clusters

ca/clusters_final:
  based_on:
    - ca/clusters
    - .plot.ca.snapshot
  enabled: false

# ... Combined plot of forest states and clusters .............................
ca/combined:
  based_on:
    - ca/forest
    - ca/forest_age
    - ca/clusters
Base Plot Configuration#
.variables:
  base_path: &base_path  data/ForestFire

  # Colormap used throughout these plots
  # NOTE The order maps to the `kind` values from 0 .. 4
  cmap: &cmap
    empty: &color_empty   darkkhaki
    tree: &color_tree     forestgreen
    ' ': none  # not used in FFM
    source: &color_source orange
    stone: &color_stone   slategrey

  cycler: &cycler !format
    fstr: "cycler('color', ['{cmap[empty]:}', '{cmap[tree]:}', '{cmap[ ]:}', '{cmap[source]:}', '{cmap[stone]:}'])"
    cmap:
      <<: *cmap


# =============================================================================
#  ╔╦╗╔═╗╔╦╗╔═╗╦  ╔═╗╔╦╗╔═╗╔═╗
#   ║ ║╣ ║║║╠═╝║  ╠═╣ ║ ║╣ ╚═╗
#   ╩ ╚═╝╩ ╩╩  ╩═╝╩ ╩ ╩ ╚═╝╚═╝
# =============================================================================
# -- Overloads ----------------------------------------------------------------
# Overload some configs to insert model-specific settings

# Model-specific defaults
.defaults:
  based_on: .defaults

  # Can define something here ...


# .. Creators .................................................................
.creator.universe:
  based_on:
    - .creator.universe
    - .defaults

  dag_options:
    select_path_prefix: *base_path

.creator.multiverse:
  based_on:
    - .creator.multiverse
    - .defaults

  select_and_combine:
    base_path: *base_path


# =============================================================================
#  ╔═╗╦  ╔═╗╔╦╗╔═╗
#  ╠═╝║  ║ ║ ║ ╚═╗
#  ╩  ╩═╝╚═╝ ╩ ╚═╝
# =============================================================================
# -- Cluster size distribution ------------------------------------------------
cluster_size_distribution:
  based_on:
    - .creator.universe
    - .plot.facet_grid.hist  # wraps xarray.plot.hist

  # Specify which data to calculate the histogram of
  select:
    cluster_size: &select_cluster_size
      path: cluster_id
      transform:
        # Look only at the last time step
        - .isel: [!dag_prev , {time: -1}]
        # Count unique cluster IDs, i.e.: the cluster sizes
        - count_unique

  transform:
    # We are interested in the log-scaled cluster sizes
    - log10: !dag_tag cluster_size
      tag: data

  # Set scales, limits, and title
  helpers:
    set_title:
      title: Cluster Size Distribution
    set_labels:
      x: $\log_{10}(A)$
      y: $N_A$
    set_scales:
      y: log
    set_limits:
      x: [0, max]
      y: [0.7, ~]

  # Configure the histogram
  bins: 30
  # ... further arguments here are passed to np.histogram (via matplotlib)


# An animation of the cluster size distribution over time
cluster_size_distribution_animated:
  based_on:
    - .animation.ffmpeg
    - cluster_size_distribution

  select:
    log10_cluster_size:
      path: cluster_id
      transform:
        - .data
        - count_unique: [!dag_prev , [x, y]]

  frames: time

  helpers:
    set_title:
      title: " "  # to not create an overlap with the time shown in the title


# -- Complementary Cumulative Cluster Size Distribution -----------------------
# ... for individual universes
compl_cum_cluster_size_dist.universe:
  based_on:
    - .creator.universe
    - .plot.facet_grid.line

  select:
    cluster_size:
      <<: *select_cluster_size

  transform:
    # Use a custom operation to compute the complementary cluster size
    # distribution. Repeated counts need to be masked because (in a cumulative
    # distribution) they represent bins with zero counts; masking these makes
    # the plot visually simpler ...
    - complementary_cumulative_distribution: !dag_tag cluster_size
      kwargs:
        mask_repeated: true
      tag: data

  helpers: &compl_cum_helpers
    set_title:
      title: &compl_cum_title Compl. Cum. Cluster Size Distribution
    set_labels:
      x: Cluster Size $[A]$
      y: $N_A$
    set_scales:
      x: log
      y: log

  linestyle: "None"
  marker: "."


# ... more generically: for sweeps
compl_cum_cluster_size_dist.multiverse:
  based_on:
    - .creator.multiverse
    - .skip.if_more_than_4D
    - .plot.facet_grid.with_auto_encoding
    - .plot.facet_grid.line

  select_and_combine:
    fields:
      data:
        path: cluster_id
        transform:
          # Look only at the last time step
          - .isel: [!dag_prev , {time: -1}]
          # Count unique cluster IDs, i.e.: the cluster sizes
          - count_unique
          # Compute the distribution
          - complementary_cumulative_distribution: !dag_prev
            kwargs:
              mask_repeated: true
          - .rename: [!dag_prev , {bin_pos: "cluster size"}]

  x: cluster size

  helpers:
    <<: *compl_cum_helpers
    set_title:
      enabled: false
    set_suptitle:
      title: *compl_cum_title

  linestyle: "None"
  marker: "."


# -- Tree density plots -------------------------------------------------------
# ... Time series for each universe ...........................................
tree_density:
  based_on:
    - .creator.universe
    - .plot.facet_grid.line
    - .hlpr.kind.time_series

  select:
    data: tree_density

  helpers:
    set_title:
      title: Tree Density
    set_labels:
      x: Time [Steps]
      y: &label_tree_density Tree Density $[1/A]$
    set_limits:
      x: [0., max]
      y: [0., 1.]

  # Passed on to plt.plot
  color: *color_tree


# .. Facet grid ...............................................................
tree_density_facet_grid:
  based_on:
    - .creator.multiverse
    - .plot.facet_grid.with_auto_encoding
    - .plot.facet_grid.line
    - .hlpr.kind.time_series

  expected_multiverse_ndim: [1, 2, 3]  # only use for multiverse plots

  select_and_combine:
    fields:
      data: tree_density

  auto_encoding: true
  kind: line
  x: time

  helpers:
    set_labels:
      y: *label_tree_density
      only_label_outer: true
    set_limits:
      y: [0., 1.]


# ... Asymptotic tree density .................................................
tree_density_asymptotic:
  based_on:
    - .creator.multiverse
    - .plot.facet_grid.errorbars

  expected_multiverse_ndim: [1, 2, 3, 4]

  dag_options:
    define:
      # The fraction of the time series at which to start the averaging
      averaging_start_fraction: 0.95

  select_and_combine:
    fields:
      tree_density:
        path: tree_density
        transform:
          - .isel_range_fraction:
              - !dag_prev
              - {time: [!dag_tag averaging_start_fraction, 1.0]}
          - .mean: [!dag_prev , [time]]

  transform:
    - .mean: [!dag_tag tree_density, [seed]]
      allow_failure: true  # TODO Make this an errorbar plot!!
      tag: mean_tree_density
      fallback: !dag_tag tree_density

    - xr.full_like: [!dag_tag mean_tree_density, .nan]
      tag: all_nan

    - .std: [!dag_tag tree_density, [seed]]
      allow_failure: true
      fallback: !dag_tag all_nan
      tag: std_tree_density

    - xr.Dataset:
      - mean_tree_density: !dag_tag mean_tree_density
        std_tree_density: !dag_tag std_tree_density
      tag: data

  y: mean_tree_density
  yerr: std_tree_density
  # FIXME This should be x and xerr, but errorbars does not support it

  # need to adjust auto-encoding to have tree density on the (free) x axis
  auto_encoding:
    line: [y, hue, col, row, frames]

  helpers:
    set_suptitle:
      title: Asymptotic Tree Density
    set_labels:
      # x: Tree Density $[1/A]$
      y: Tree Density $[1/A]$
    set_limits:
      # x: [0., ~]
      y: [0., ~]

  linestyle: "None"
  marker: "."


tree_density_asymptotic_over_p_lightning:
  based_on: tree_density_asymptotic

  x: p_lightning

  helpers:
    set_labels:
      x: Lightning Probability
    set_scales:
      x: log


# -- Tree age -----------------------------------------------------------------
mean_tree_age:
  based_on:
    - .creator.multiverse
    - .skip.if_more_than_3D
    - .plot.facet_grid.with_auto_encoding
    - .plot.facet_grid.errorbands
    - .hlpr.kind.time_series

  select_and_combine:
    fields:
      age_mean:
        path: age
        transform:
          - where: [!dag_prev , ">", 0]  # removes cells that are no trees
          - .mean: [!dag_prev , [x, y]]
      age_std:
        path: age
        transform:
          - where: [!dag_prev , ">", 0]
          - .std: [!dag_prev , [x, y]]

  transform:
    - xr.Dataset:
        - age mean: !dag_tag age_mean
          age std: !dag_tag age_std
      tag: data

  x: time
  y: age mean
  yerr: age std

  helpers:
    set_suptitle:
      title: Mean Tree Age
    set_labels:
      x: Time [Steps]
      y: Mean Age [Steps]
      only_label_outer: true
    set_limits:
      y: [0., ~]


  # Passed on to facet grid errorbar plot
  # ...


# -- CA plots -----------------------------------------------------------------
# These are animated by default but can be assembled into snapshots by
# additionally inheriting the `.plot.ca.snapshot` configuration.
# ... The forest ..............................................................
ca/forest:
  based_on:
    - .creator.universe
    - .plot.ca

  select:
    kind: kind

  to_plot:
    kind:
      title: Forest State
      cmap: *cmap

# ... The forest age ..........................................................
ca/forest_age:
  based_on:
    - .creator.universe
    - .plot.ca

  select:
    age: age

  to_plot:
    age:
      title: Forest Age
      cmap: YlGn
      vmin: 0
      vmax: max

# ... The clusters ............................................................
ca/clusters:
  based_on:
    - .creator.universe
    - .plot.ca

  select:
    cluster_id:
      path: cluster_id
      with_previous_result: true
      transform:
        - where: ["!=", 0]       # 0 is masked: not part of a cluster
        - np.fmod: 20            # ... to match the tab20 color map

  to_plot:
    cluster_id:
      title: Clusters
      cmap: tab20
      vmin: 0
      vmax: 20
      no_cbar_markings: true
For available base plots, see Base Plot Configuration Pool.
References#
Bak, P., K. Chen and C. Tang, 1990: A forest-fire model and some thoughts on turbulence, Phys. Lett. A, 147, (5-6), 297–300, doi: 10.1016/0375–9601(90)90451–S
Kurt Roth: Complex, Chaotic and Evolving Environmental Systems (Lecture Notes). Chapter: Discrete Complex Systems — Contact Processes